Acceleration
Rolling Start vs Standing Start: Two Different Cars
A 100 to 200 km/h time removes tyres, launch technique and surface from the measurement, which leaves power against weight and drag. It is the cleanest engine test a road can give you.
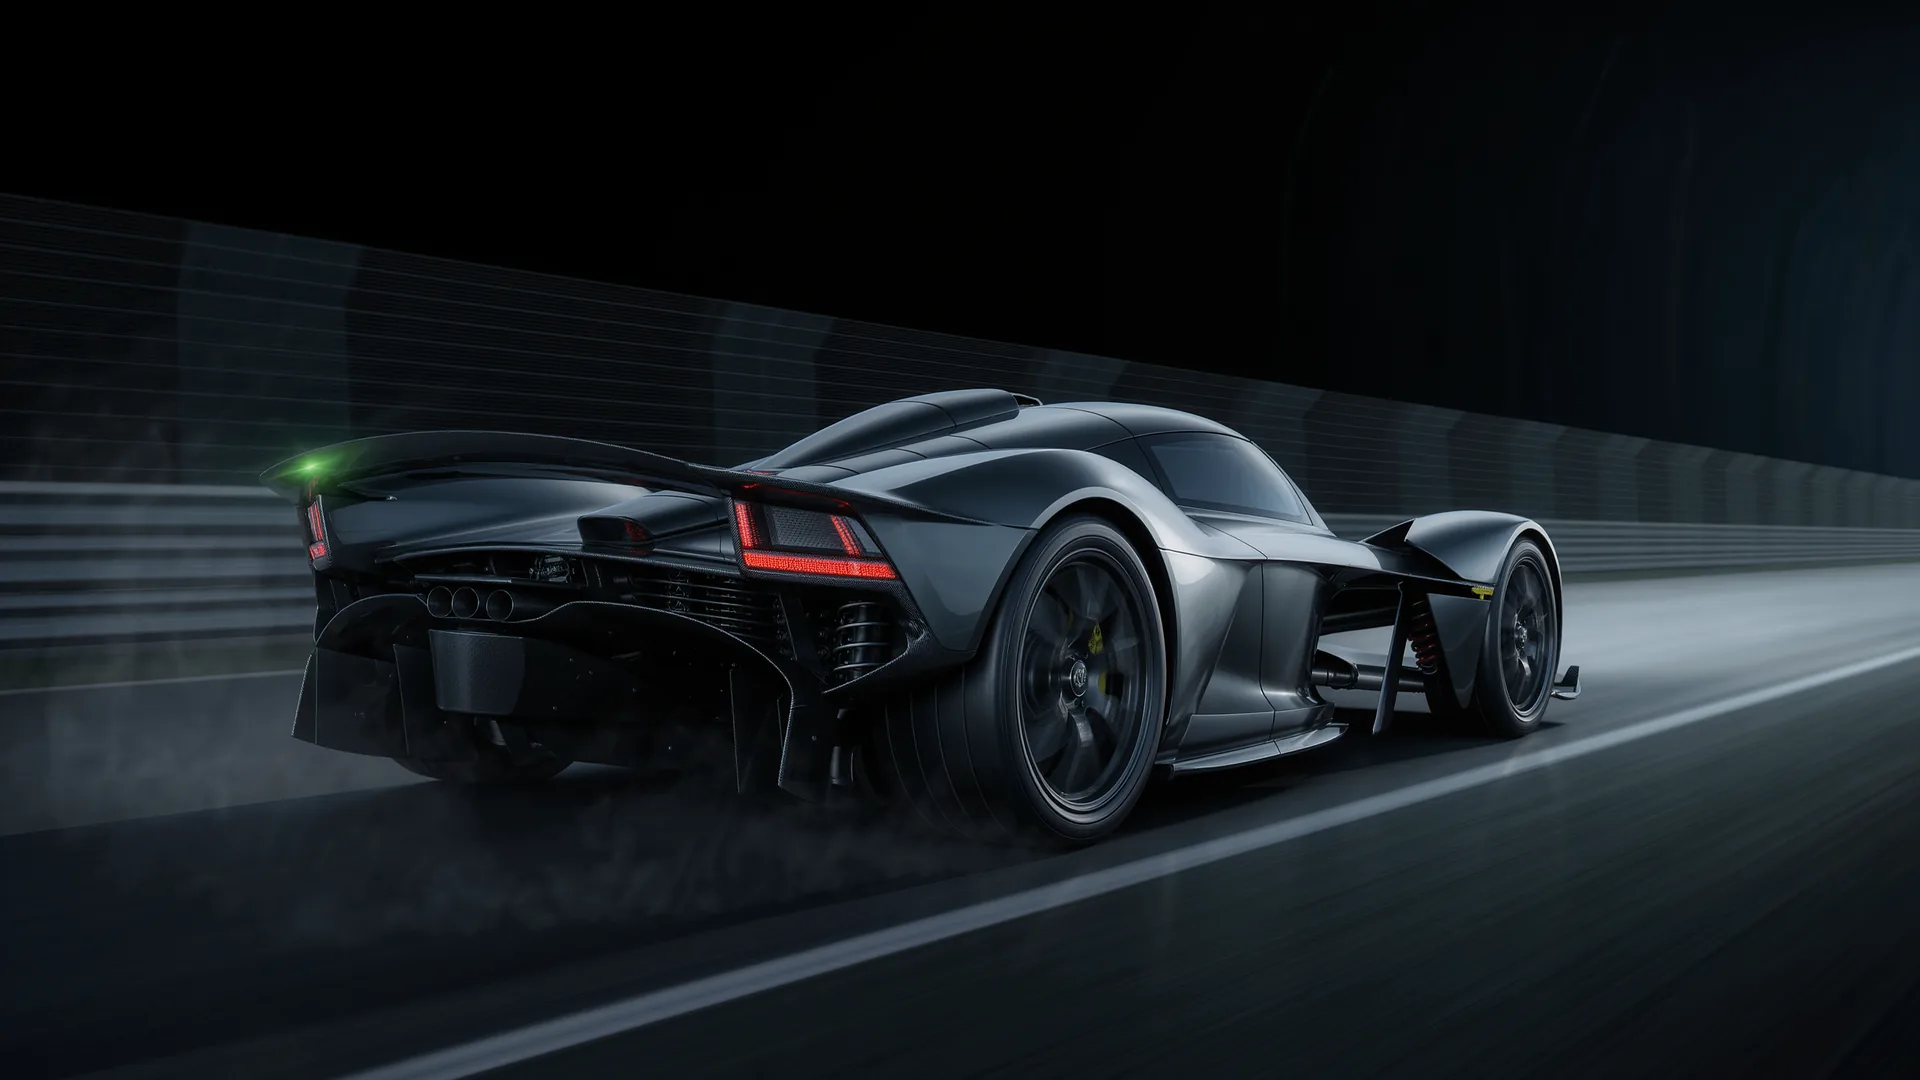
A standing start measures the tyres, the driver, the surface and the drivetrain. A rolling start measures almost none of that. Once the car is already moving at 100 km/h, traction has stopped being the limit and the run becomes a straight contest of power against weight and drag. That is why 100 to 200 km/h separates engines that a 0 to 100 figure declares equal.
What a rolling start removes from the measurement
Below roughly 100 km/h most performance cars are limited by grip rather than power. Above it, the force the tyres could deliver exceeds what the engine can supply, so every variable that dominates a launch stops mattering. Tyre compound, surface preparation, weight distribution, launch control calibration and driver skill all fall away, and what is left is the engine, the gearing, the mass and the shape.
This is the reason two very different cars can share a 0 to 100 km/h time and be a second apart from 100 to 200. The first figure was a tyre test that both cars passed. The second one is not.
The arithmetic of a rolling run
The work needed is the change in kinetic energy, ½m(v₂² − v₁²). From 100 km/h, 27.78 m/s, to 200 km/h, 55.56 m/s, on a 1,600 kg car that is 1.85 MJ. If power were constant and there were no losses, time would simply be that energy divided by power.
| Power at the wheels | In hp | Ideal time | Realistic time | Power per tonne |
|---|---|---|---|---|
| 200 kW | 268 hp | 9.26 s | 10.2 to 10.6 s | 125 kW/t |
| 300 kW | 402 hp | 6.17 s | 6.8 to 7.0 s | 188 kW/t |
| 400 kW | 536 hp | 4.63 s | 5.1 to 5.3 s | 250 kW/t |
| 500 kW | 671 hp | 3.70 s | 4.1 to 4.2 s | 313 kW/t |
| 700 kW | 939 hp | 2.65 s | 2.9 to 3.0 s | 438 kW/t |
The ideal column is a floor that no car reaches, for three reasons. Aerodynamic drag and rolling resistance absorb roughly 8 to 12 per cent of the work over this speed range for an ordinary shape, and considerably more for a car carrying a large wing. Engines do not hold peak power across the whole band, they follow a curve. And every gearshift interrupts the delivery entirely, which on a run spanning two or three ratios is worth a meaningful fraction of a second.
The three formats you will meet
- 100 to 200 km/h. The European standard, quoted by manufacturers and enthusiast publications alike. Wide enough to expose a power difference, high enough to be firmly out of the traction limited region.
- 5 to 60 mph rolling. An American format designed to remove launch technique from a 0 to 60 figure without leaving the low speed range. Useful for showing what a car's launch was worth, since the difference between it and the standing figure is the launch itself.
- 60 to 130 mph. The tuning community's preference, roughly 97 to 209 km/h, and close enough to 100 to 200 km/h to be compared with care. It sits in the range where modifications show up most clearly.
None of these is interchangeable with another. The energy required scales with the difference of the squares of the two speeds, so even a small change in the end points moves the answer a long way. A 60 to 130 mph run demands about 13 per cent more energy than 100 to 200 km/h on the same car.
What the pair of numbers tells you
Read a standing figure and a rolling figure together and the car separates into its parts.
- Strong standing, weak rolling. Excellent traction and modest power. Typical of a heavy all wheel drive car with a large tyre, and typical of many electric cars once the first burst is over.
- Weak standing, strong rolling. Plenty of power that the tyres cannot use at low speed. Classic front engined rear wheel drive behaviour, and the reason such cars feel underwhelming at a traffic light and untouchable on an open road.
- Both strong. Either very high power with all wheel drive, or a light car. The rolling figure tells you which, because mass cannot hide from an energy calculation.
Questions readers ask
Why is a rolling start figure more useful than 0 to 100 km/h?
Because it removes the variables that dominate a launch. Above about 100 km/h the car is limited by power rather than grip, so tyres, surface, weight distribution and driver skill stop deciding the outcome and the measurement becomes a test of power against weight and drag.
How much energy does a 100 to 200 km/h run need?
½m(v₂² − v₁²), which is 1.85 MJ for a 1,600 kg car. At 500 kW at the wheels with no losses that would take 3.70 s, and a realistic figure is 4.1 to 4.2 s once drag, rolling resistance, the shape of the power curve and gearshifts are included.
Can I compare 60 to 130 mph with 100 to 200 km/h?
Only loosely. 60 to 130 mph is 97 to 209 km/h and demands roughly 13 per cent more energy on the same car, because the work scales with the difference of the squares of the two speeds. Treat the two as related, never as equivalent.
Why do some cars look fast standing and slow rolling?
They have more traction than power. All wheel drive with a wide tyre puts a good standing figure within reach of a fairly ordinary engine, and the rolling run then exposes the shortfall because grip no longer helps.
Does drag matter much between 100 and 200 km/h?
Yes, and it grows quickly. Drag force rises with the square of speed, so it is roughly four times larger at 200 km/h than at 100. Over the whole run it absorbs about 8 to 12 per cent of the work for a typical shape, and considerably more for a car with a large fixed wing.
Sources
- 0 to 60 mph, on standing and rolling start conventions and how each is quoted.
- Rollout (drag racing), on why standing start timing conventions vary between markets.
- Quarter mile calculator, on the power, weight and speed relationships used for the ideal time column.
Ideal times are energy divided by constant power for a 1,600 kg vehicle. Realistic times add 10 to 13 per cent for aerodynamic drag, rolling resistance, the shape of a real power curve and gearshift interruptions.