Power and Weight
Drivetrain Loss: Why the Dyno Reads Lower
The 15 per cent rule is wrong. A good manual gearbox is over 99 per cent efficient and a hypoid final drive over 98.5, so real mechanical loss is nearer 2.5 per cent.
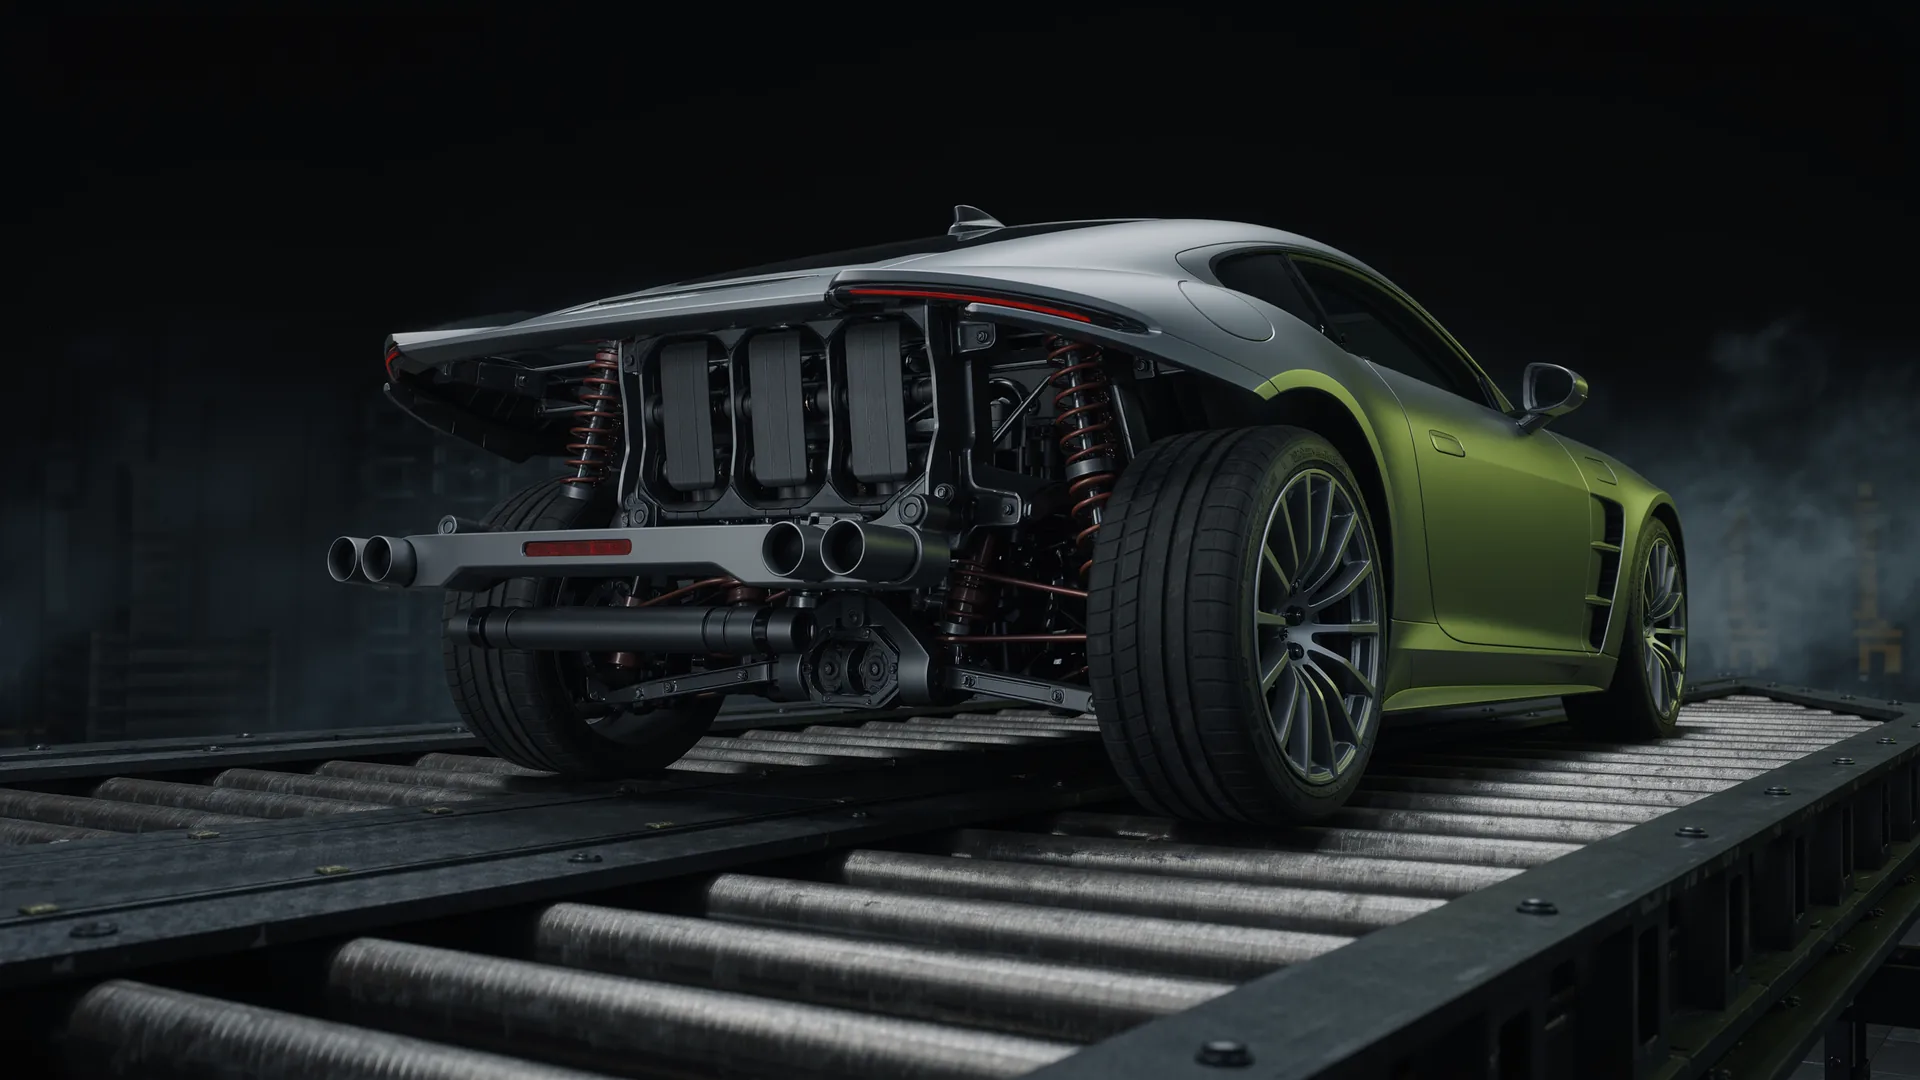
The familiar rule that a rear wheel drive car loses 15 per cent between crankshaft and wheels does not survive contact with the components. A good manual gearbox is over 99 per cent efficient and a good hypoid final drive over 98.5 per cent, which gives a total mechanical efficiency around 97.5 per cent. The gap between that figure and what a dynamometer shows is real, and almost none of it is gears.
What the components actually cost
| Element | Loss per pass | Notes |
|---|---|---|
| Spur or helical gear mesh, with bearings | 1 % or less | Applies in indirect gears |
| Hypoid final drive mesh, with bearings | 1.5 % or less | The offset axis costs more than a helical mesh |
| Direct drive top gear | ≈0 % | Power passes straight through the mainshaft |
| Good manual gearbox, overall | under 1 % | Windage and oil churning included |
| Total, manual rear wheel drive | ≈2.5 % | Gearbox plus final drive |
Measured in a direct drive 1:1 gear, where power passes straight through the mainshaft with no gearbox mesh at all, published total at-the-wheel losses fall as low as 1.5 to 2 per cent. The only remaining sources are windage, friction and drag. That single measurement is enough to dispose of a 15 per cent rule.
So why does a dynamometer read so much lower
Because a rolling road measures more than the gearbox. Four things sit between the crankshaft and the number on the screen, and only the first is what people mean by drivetrain loss.
- Mechanical gear losses, around 2.5 per cent for a manual rear wheel drive car in an indirect gear.
- Tyre deformation on the roller. A tyre pressed against a curved steel drum flexes far more than it does on flat road, and that hysteresis is dissipated as heat. This is often the largest single term on a rolling road.
- Rotational inertia during a sweep. A power run accelerates the wheels, brake discs, driveshafts and the roller itself. Energy going into spinning those up is not available at the contact patch, and the faster the sweep, the more is absorbed.
- Which gear was used. Direct drive costs almost nothing while an indirect gear adds a mesh, so the same car reads differently in third and fourth.
None of those four is a constant percentage, which is the deeper problem with the rule of thumb.
Why a percentage is the wrong shape
Drivetrain losses have a large component that depends on speed rather than on transmitted torque: oil churning, bearing drag and windage continue whether the engine is making 100 kW or 500 kW. Applying a flat percentage assumes the loss scales with power, and it does not.
The consequence is systematic. On a low output engine, a fixed loss is a large share of the total. On a high output engine, the same fixed loss is a small share. A flat 15 per cent therefore overstates the loss on a powerful car, sometimes badly. Adding 15 per cent to a 500 kW wheel reading produces 588 kW at the crank, when 97.5 per cent efficiency plus a realistic tyre and inertia allowance suggests something closer to 540 to 555 kW.
All wheel drive, which genuinely costs more
An all wheel drive car adds a transfer case and a front final drive to the path, each with its own mesh and bearings, plus additional oil to churn and more rotating mass to accelerate. Two extra hypoid or bevel meshes at up to 1.5 per cent each puts total mechanical loss in the region of 5 to 6 per cent rather than 2.5.
That is still nothing like the 25 per cent sometimes quoted for all wheel drive on a rolling road. The difference is that a four wheel drive dynamometer run adds a second set of rollers, a second set of tyres deforming, and considerably more inertia, all of which are properties of the measurement rather than of the car.
How to use a dynamometer figure properly
Treat it as a comparative instrument, not an absolute one. The same car, on the same dynamometer, in the same gear, at the same sweep rate, before and after a change, gives a trustworthy difference. Converting a wheel figure into a crankshaft figure with any fixed multiplier produces a number that cannot be checked and should not be quoted next to a manufacturer's net power figure measured to SAE J1349, DIN 70020 or UNECE Regulation 85.
Questions readers ask
How much power is lost between the crankshaft and the wheels?
Mechanically, far less than the usual rule suggests. A good manual gearbox is over 99 per cent efficient and a hypoid final drive over 98.5, giving roughly 2.5 per cent total for a manual rear wheel drive car. Measured in direct drive, published wheel losses fall to 1.5 to 2 per cent.
Why does my dyno read 15 per cent below the brochure then?
Because a rolling road measures more than the gearbox. Tyre deformation against a curved drum, rotational inertia absorbed during the sweep and the choice of gear all add to the mechanical loss, and none of them is a property of the car's drivetrain.
Is drivetrain loss a fixed percentage?
No. A large part of it depends on rotational speed rather than transmitted torque, so oil churning, bearing drag and windage continue regardless of how much power is being made. A flat percentage therefore overstates the loss on a high output engine.
How much more does all wheel drive lose?
Mechanically, roughly 5 to 6 per cent against 2.5 for rear wheel drive, because a transfer case and a front final drive each add a mesh at up to 1.5 per cent. The much larger figures sometimes quoted come from the measurement setup rather than the car.
Can I convert wheel power to crank power?
Not reliably with any fixed multiplier. Use a dynamometer as a comparative instrument instead: same car, same machine, same gear, same sweep rate, before and after a change. That difference is trustworthy in a way the absolute conversion is not.
Sources
- Drivetrain loss explained, on manual gearbox and hypoid final drive efficiency and the 1.5 to 2 per cent measured in direct drive.
- Drivetrain losses and efficiency, on the breakdown of losses by component and why they are not proportional to transmitted power.
- Hypoid gear efficiency, on the efficiency of an offset axis final drive against a helical mesh.
- UNECE Regulation No. 85, on the net power standard a dynamometer figure is usually being compared against.