Electric Performance
Range at 200 km/h: The Number Nobody Advertises
A Tesla Model Y measured 14.1 kWh per 100 km at 90 km/h and 22.2 at 130. That is 57 per cent more energy for 44 per cent more speed, and it gets worse from there.
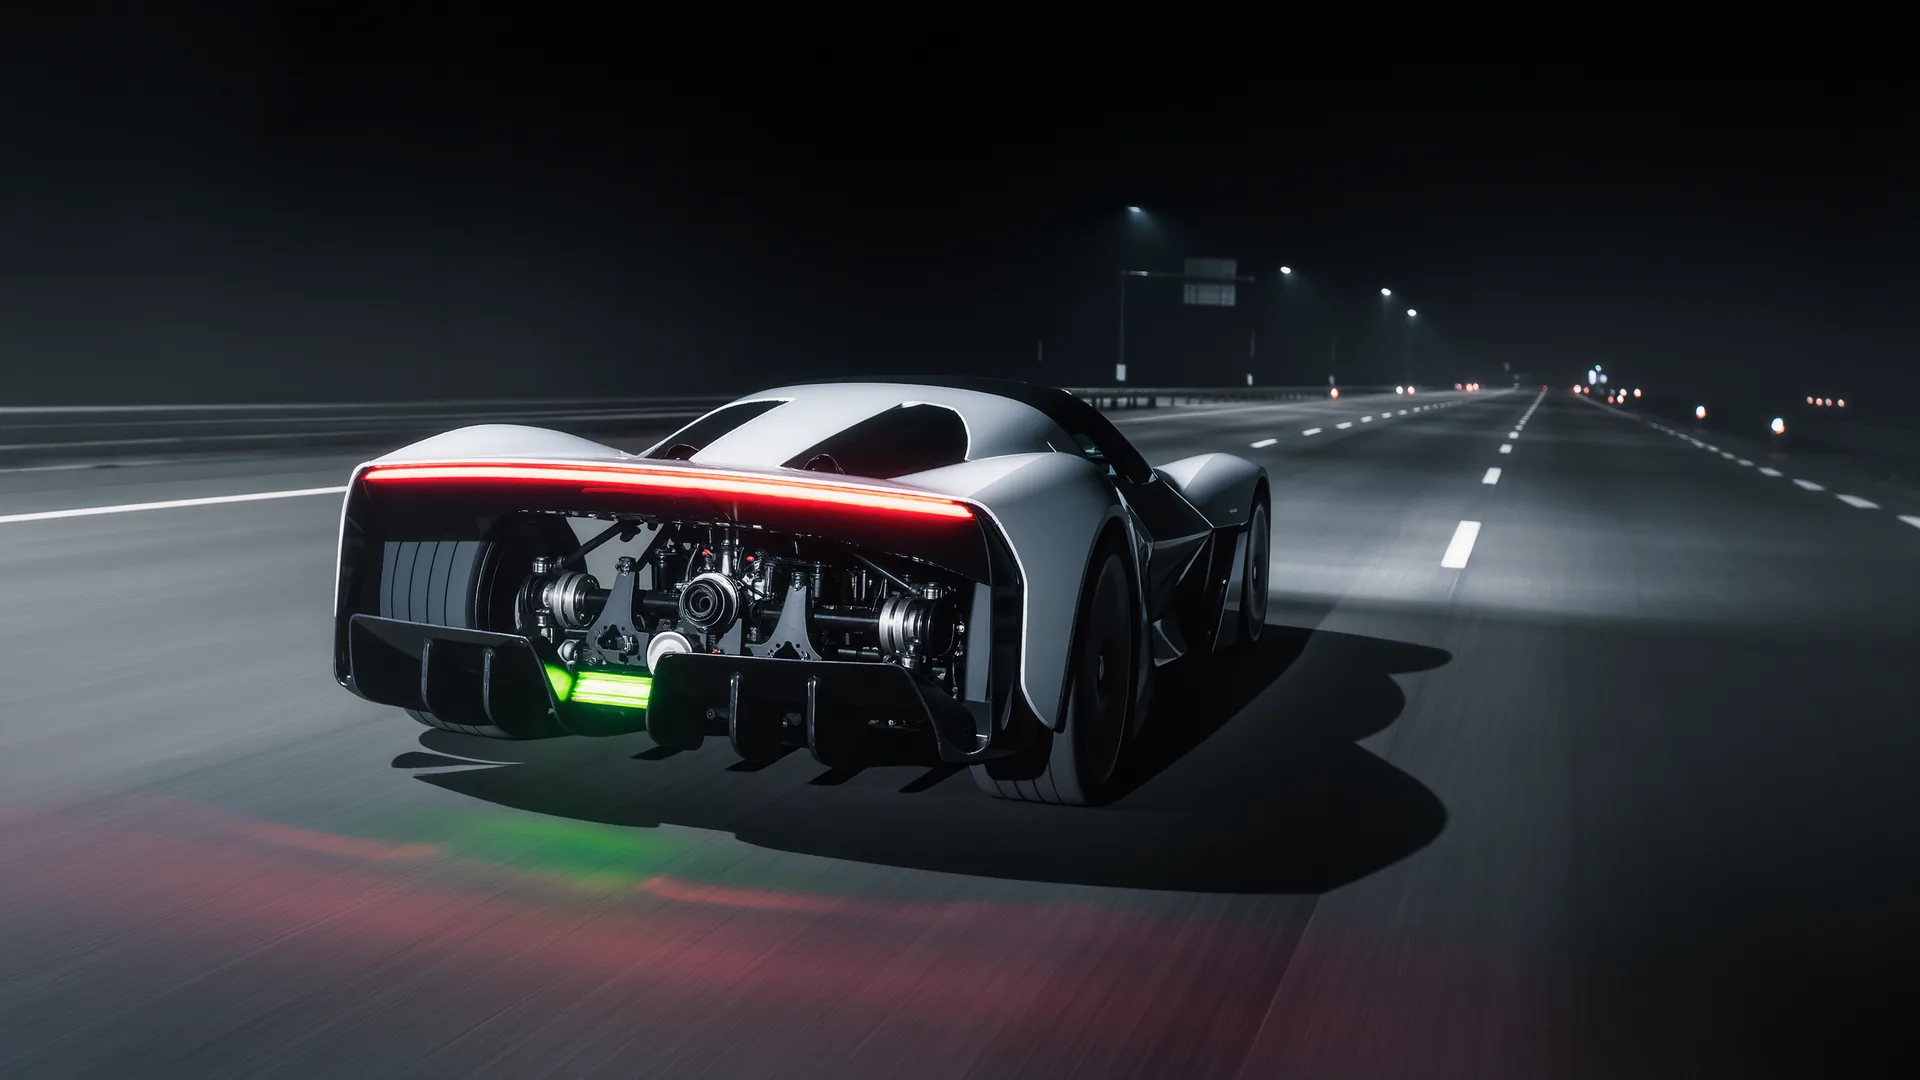
Electric range collapses with speed faster than combustion range does, because an EV has no idling losses to hide behind and its drivetrain is already efficient. Measured figures make the point: a Tesla Model Y consumed 14.1 kWh per 100 km at 90 km/h and 22.2 kWh per 100 km at 130 km/h. That is 57 per cent more energy for 44 per cent more speed, and across a set of eight cars a constant 130 km/h cost around 40 per cent of range.
Why the curve is so steep
Energy per kilometre is force multiplied by distance, so consumption per 100 km is proportional to the resisting force at that speed. Rolling resistance is roughly constant with speed, while aerodynamic drag rises with the square of it. Going from 90 to 130 km/h multiplies the aerodynamic term by 2.09 while leaving the rolling term alone.
Work the measured Model Y figures against that model and they fit. If roughly 8.5 kWh of the 14.1 at 90 km/h is aerodynamic and 5.6 kWh is everything else, then at 130 km/h the aerodynamic share becomes 17.7 kWh and the total 23.3 kWh, against 22.2 measured. Close enough to confirm that drag is doing almost all of the damage.
| Speed | Aerodynamic share | Everything else | Total per 100 km | Against 90 km/h |
|---|---|---|---|---|
| 90 km/h | 8.5 kWh | 5.6 kWh | 14.1 kWh | reference |
| 110 km/h | 12.7 kWh | 5.6 kWh | 18.3 kWh | +30 % |
| 130 km/h | 17.7 kWh | 5.6 kWh | 23.3 kWh | +65 % |
| 160 km/h | 26.9 kWh | 5.6 kWh | 32.5 kWh | +130 % |
| 200 km/h | 42.0 kWh | 5.6 kWh | 47.6 kWh | +237 % |
At 200 km/h the same car is using more than three times the energy per kilometre it uses at 90. A 75 kWh battery that covers 532 km at 90 km/h covers around 158 km at 200, and that is before charging losses, climate control or a reserve.
Why the official figure never shows this
The WLTP procedure averages 46.5 km/h over roughly 30 minutes and about 23 km. That average is far below motorway speed, so the certified range is measured in a regime where aerodynamic drag is a modest share of total resistance. It is a repeatable, comparable procedure and it was never designed to describe a sustained autobahn cruise.
The gap that follows is well documented: real world range can be up to 30 per cent below the WLTP figure, and in cold conditions between 0 and −10 °C a shortfall of 10 to 23 per cent against WLTP is reported. Motorway driving at a constant 130 km/h costs around 40 per cent. Those are different effects and they add.
Why it feels worse than in a combustion car
A combustion car suffers the same aerodynamic physics, and its range still falls at speed. What differs is the baseline. A combustion engine is inefficient at low load, so at 90 km/h a large share of its fuel is already being wasted as heat, and raising speed moves it toward a more efficient operating point that partly offsets the extra drag. An electric drivetrain has no such slack: it is already efficient at low load, so the extra drag arrives undiluted.
The second difference is refuelling. A combustion car with a shorter range refuels in minutes. An electric car with a shorter range needs a charging stop, and a battery that has been worked hard at high speed is hot, which slows charging further.
Questions readers ask
How much range does an electric car lose at high speed?
Around 40 per cent at a constant 130 km/h, based on tests across eight cars. A Tesla Model Y measured 14.1 kWh per 100 km at 90 km/h against 22.2 at 130, which is 57 per cent more energy for 44 per cent more speed.
Why does speed hurt an EV more than a combustion car?
Because the electric drivetrain has no inefficiency to hide the extra drag behind. A combustion engine is wasteful at low load, so raising speed moves it to a better operating point that partly offsets the drag. An electric motor is already efficient, so the drag arrives undiluted.
Why does the official range figure not reflect this?
Because the WLTP cycle averages 46.5 km/h over roughly 30 minutes and 23 km, far below motorway speed. At that average, aerodynamic drag is a modest share of total resistance, so the certified figure describes a regime a motorway journey never enters.
How much would slowing down save?
A great deal, because consumption follows the square of speed for the aerodynamic share. Dropping from 130 to 110 km/h cuts the aerodynamic term by 28 per cent, which on the model above takes consumption from 23.3 to 18.3 kWh per 100 km, a saving of over a fifth.
Does cold weather add to this?
Yes, and separately. Between 0 and −10 °C, real world range has been found 10 to 23 per cent below the WLTP figure from cabin heating and battery conditioning alone, before any speed effect is counted.
Sources
- Electric car consumption comparison, for the 14.1 kWh per 100 km at 90 km/h and 22.2 kWh at 130 km/h measurements.
- High speed autobahn range test, on the roughly 40 per cent range loss at a sustained 130 km/h across a group of cars.
- How WLTP range is really calculated, on the 46.5 km/h average speed and the structure of the test cycle.
- WLTP range against reality, on the up to 30 per cent real world shortfall and the 10 to 23 per cent cold weather figure.
The aerodynamic and constant split is fitted to the two measured Model Y points and used to extrapolate; it is an illustrative model rather than a measurement at every speed.