Electric Performance
WLTP vs Reality: Reading an Efficiency Figure
The WLTP cycle averages 46.5 km/h over about 23 km and 30 minutes. Real range can be 30 per cent lower, and a constant 130 km/h costs around 40 per cent on its own.
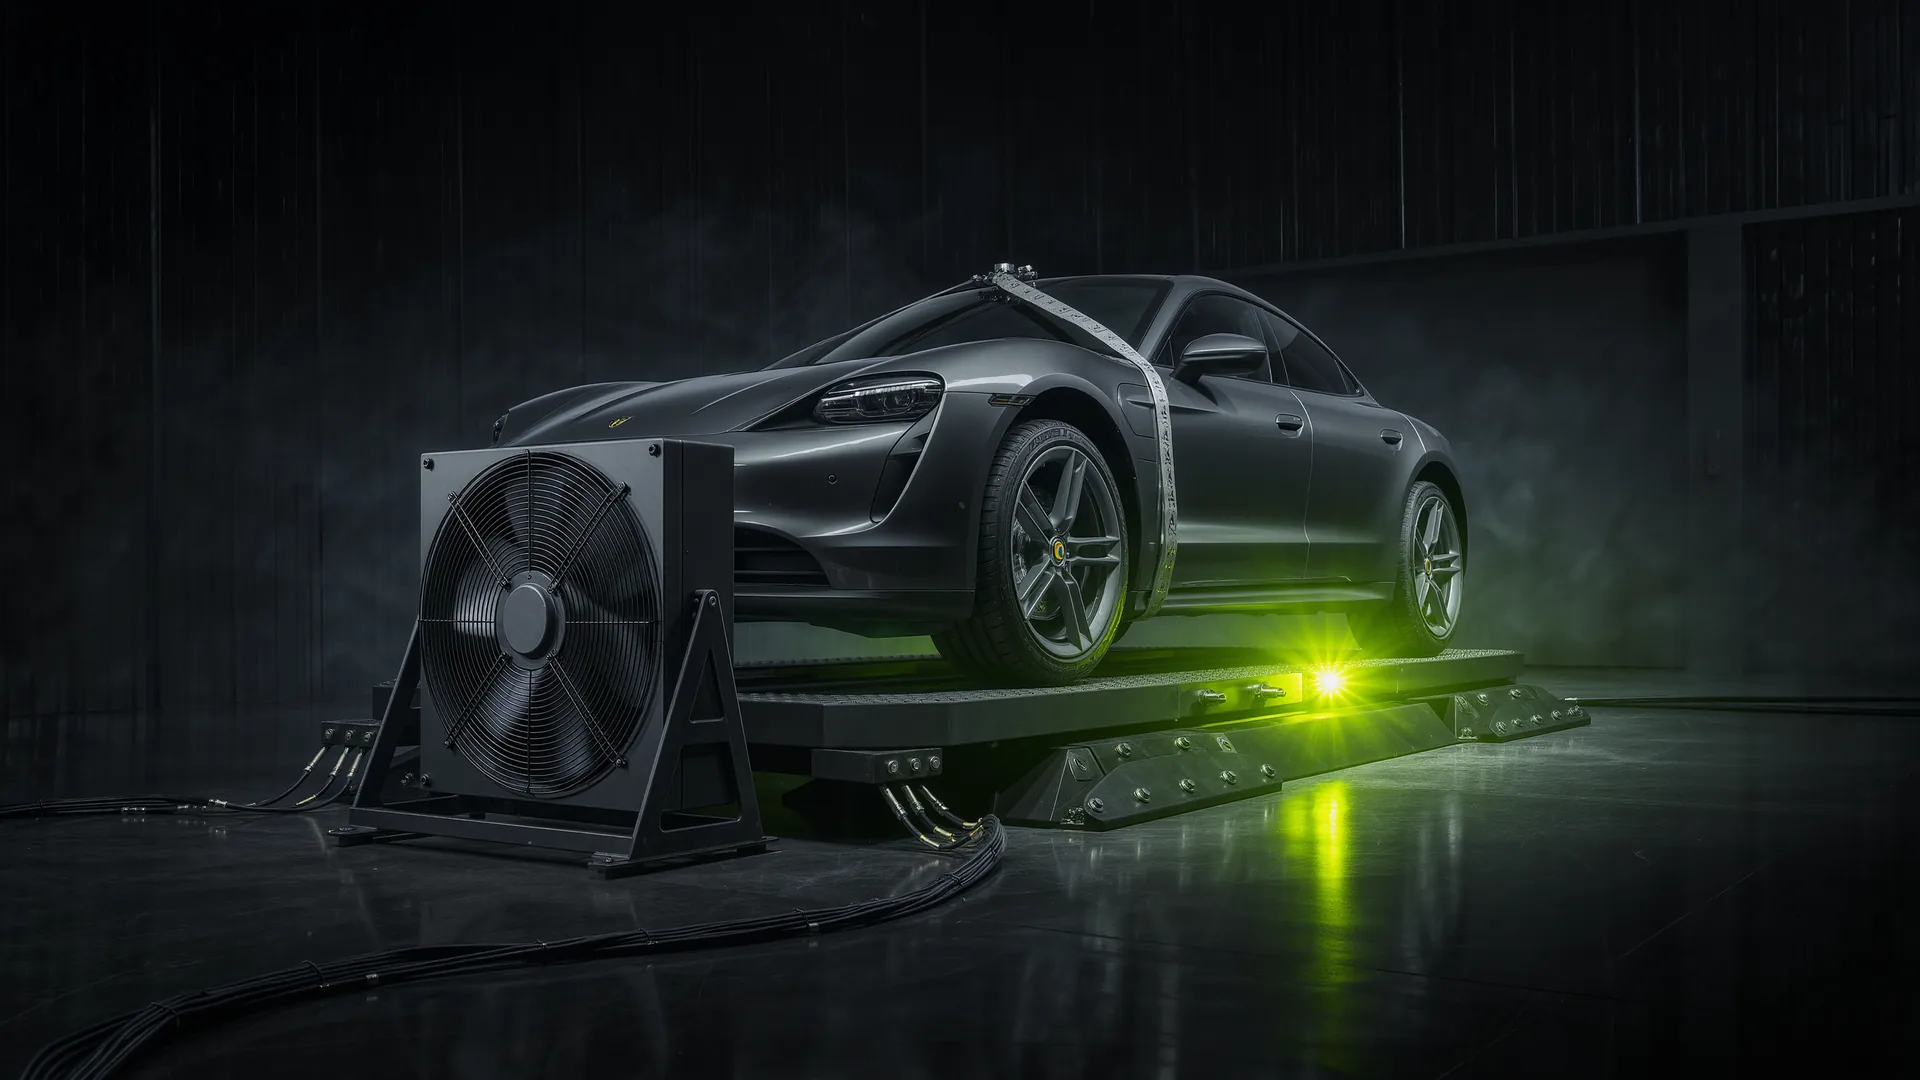
The WLTP figure is not a prediction, it is a comparison instrument, and it does its job well. The cycle averages 46.5 km/h over roughly 23 km in about 30 minutes, which is far below motorway speed. Real world range can be up to 30 per cent lower, cold weather between 0 and −10 °C accounts for 10 to 23 per cent, and a constant 130 km/h costs around 40 per cent on its own.
What the procedure is
The WLTP cycle is assembled from four sub-cycles, low, medium, high and extra high, run in sequence on a chassis dynamometer under controlled conditions. Combining them gives an average speed of 46.5 km/h across roughly 23 km and about 30 minutes. Every car is measured the same way, which is exactly what makes the figures comparable with each other.
The gap with reality is not a flaw in the procedure, it is a consequence of what the procedure is for. A repeatable laboratory test cannot also be a description of one driver's commute, and any attempt to make it so would destroy the comparability that is its entire purpose.
Where the shortfall comes from
| Effect | Size | Cause | Under your control? |
|---|---|---|---|
| General real world driving | up to 30 % | Acceleration, traffic, terrain, load | Partly |
| Cold weather, 0 to −10 °C | 10 to 23 % | Cabin heating, battery conditioning | Barely |
| Sustained 130 km/h | ≈40 % | Aerodynamic drag rising with the square of speed | Yes |
The third row is both the largest and the only one a driver fully controls. A Tesla Model Y measured 14.1 kWh per 100 km at 90 km/h and 22.2 kWh at 130 km/h, which is 57 per cent more energy for 44 per cent more speed. Dropping from 130 to 110 km/h recovers a substantial part of that, because the aerodynamic term falls by 28 per cent.
Why cold weather is worse for an EV
A combustion car heats its cabin with waste heat it was producing anyway, so winter heating is close to free. An electric car has no meaningful waste heat and must take cabin warmth from the battery, either through a resistive heater or, more efficiently, a heat pump. On top of that the pack itself has to be brought into and kept inside its temperature window, which costs energy again.
Both costs are largely fixed per hour rather than per kilometre, so they hurt most on short, slow journeys. A ten minute trip in winter can show consumption several times the WLTP figure, and nothing is wrong with the car.
Using the figure properly
- Compare cars, do not predict journeys. Two WLTP figures measured the same way rank two cars correctly even when neither number describes your driving.
- Apply your own correction factor. After a few thousand kilometres you will know your personal ratio to WLTP, and it will be stable, because your driving is.
- Separate the effects. Speed, temperature and driving style are three different corrections and they add. A winter motorway journey collects all three.
- Read consumption, not range. Range depends on usable capacity, which changes with state of health. Consumption in kWh per 100 km is the honest quantity and it is what the physics acts on.
Questions readers ask
How accurate is the WLTP range figure?
As a comparison instrument, very. As a prediction, real world range can be up to 30 per cent lower. Cold weather between 0 and −10 °C accounts for 10 to 23 per cent, and a sustained 130 km/h costs around 40 per cent on its own.
What is the WLTP cycle?
Four sub-cycles, low, medium, high and extra high, run in sequence on a chassis dynamometer. Combined they average 46.5 km/h over roughly 23 km in about 30 minutes, with every car measured identically.
Why does the test not reflect motorway driving?
Because its average speed is 46.5 km/h, far below motorway speed, so aerodynamic drag is a modest share of total resistance throughout. A repeatable laboratory procedure cannot also describe one driver's route without losing the comparability that is its purpose.
Why is winter so expensive for an electric car?
Because there is no waste heat to use. Cabin warmth comes from the battery, and the pack itself has to be kept inside its temperature window. Both costs are roughly per hour rather than per kilometre, so short slow journeys suffer most.
What is the single biggest thing I control?
Speed. Consumption follows the square of speed for the aerodynamic share, so going from 130 to 110 km/h cuts that term by 28 per cent. A measured example puts a Tesla Model Y at 14.1 kWh per 100 km at 90 km/h against 22.2 at 130.
Sources
- How WLTP range is really calculated, on the 46.5 km/h average speed, the sub-cycle structure and the roughly 23 km and 30 minute duration.
- WLTP range against reality, on the up to 30 per cent real world shortfall and the 10 to 23 per cent cold weather figure.
- Electric car consumption comparison, for the 14.1 and 22.2 kWh per 100 km measurements at 90 and 130 km/h.
- High speed autobahn range test, on the roughly 40 per cent range loss at a sustained 130 km/h.