Power and Weight
Weight Distribution: Why 50:50 Is Not Always the Target
A rear engined car at 61 per cent rear launches 0.91 s quicker to 100 km/h than a front engined one at 48. What helps traction hurts braking, so 50:50 is a compromise, not an optimum.
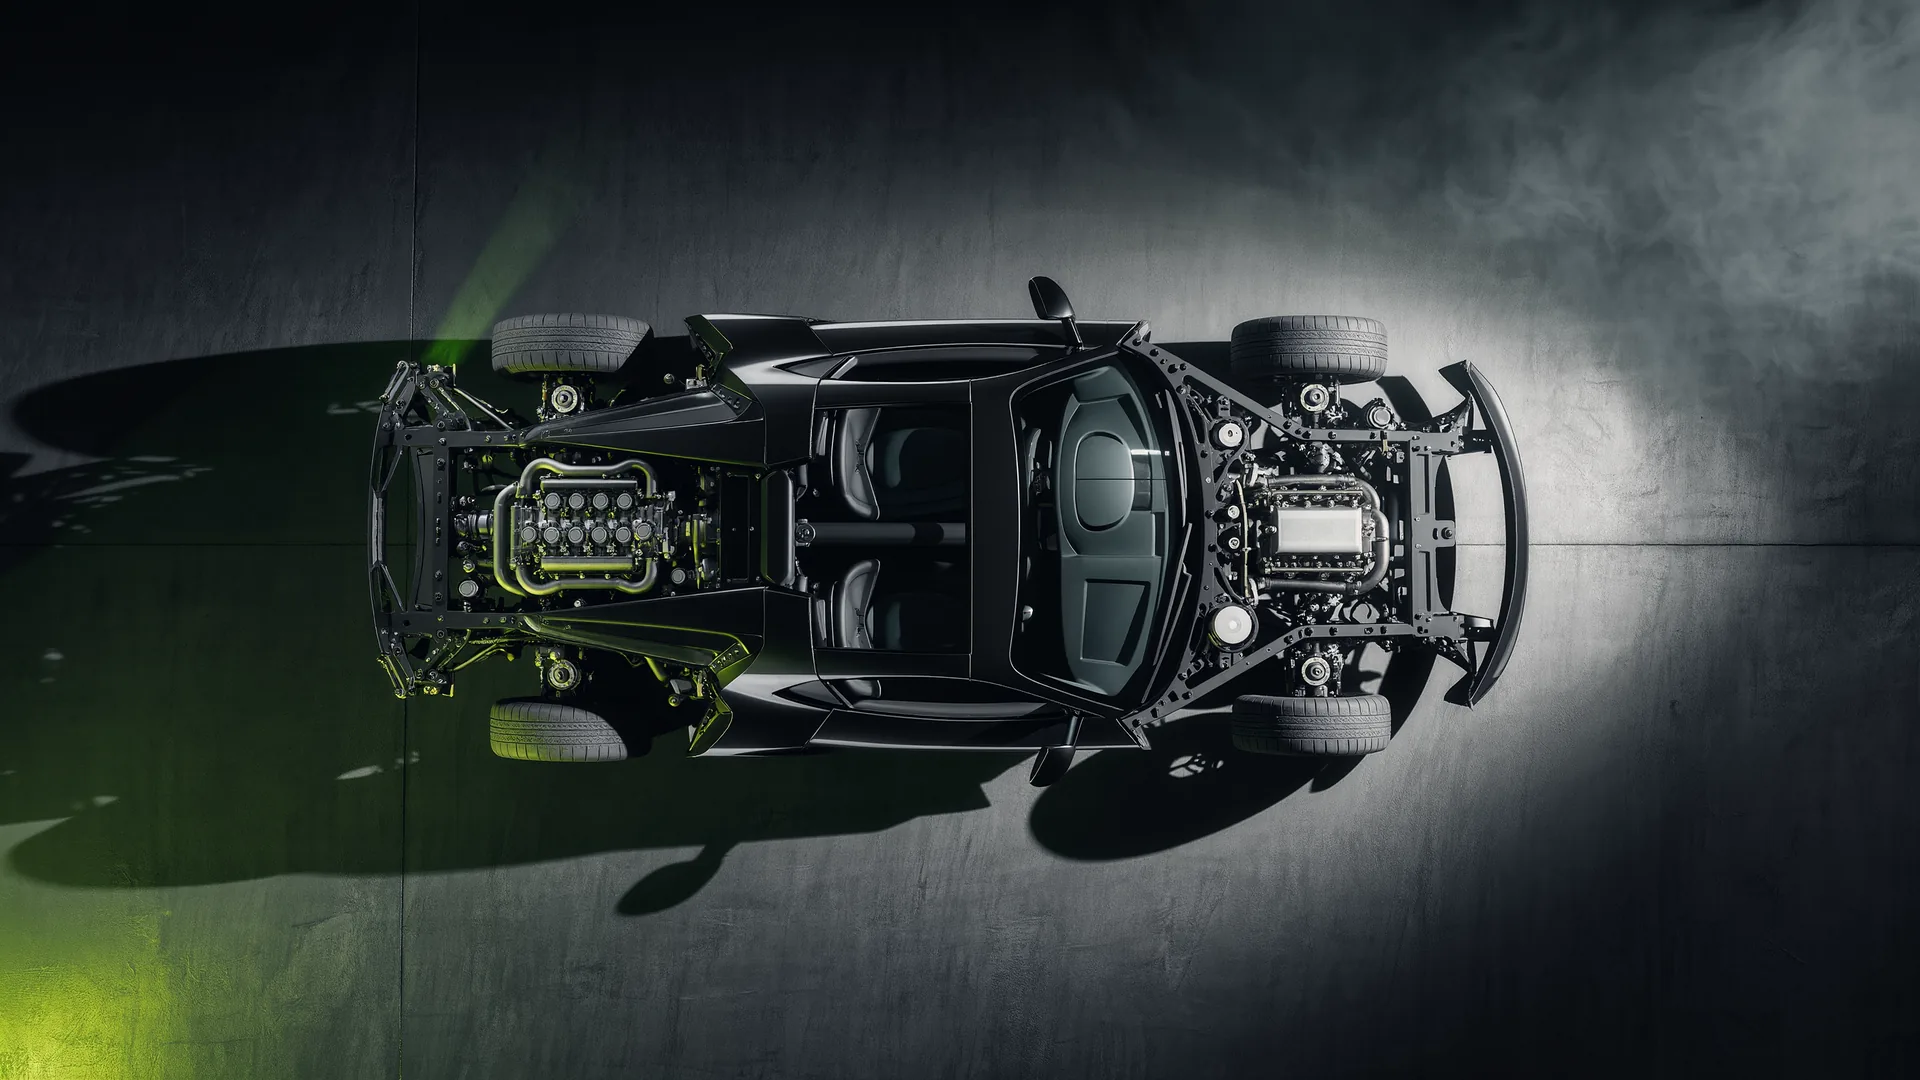
50:50 is a marketing figure that describes a compromise, not a peak. Weight distribution decides how much load sits over each axle before anything moves, and different manoeuvres want different answers. Accelerating wants weight at the back: a rear engined car at 61 per cent rear reaches 8.72 m/s² on a road tyre where a front engined car at 48 per cent manages 6.78. Braking wants the opposite, because load transfers forward.
The conflict, stated plainly
| Manoeuvre | Load transfers | Wants static weight | Because |
|---|---|---|---|
| Accelerating, rear drive | Rearward | At the rear | Driven tyres need vertical load |
| Braking | Forward | At the front, but not too much | Front tyres do most of the work anyway |
| Turn-in | Forward and outward | At the front | Front tyres need load to steer |
| Mid corner | Outward | Balanced | Both axles working equally |
| Corner exit | Rearward | At the rear | Traction again |
Read the column of answers and the reason 50:50 exists becomes obvious. It is the distribution that is never badly wrong, which is a genuine engineering virtue and a different claim from being optimal for anything.
What it is worth off the line
For a rear wheel drive car the launch limit resolves to a = μ · g · f / (1 − μ · h / L), where f is the static rear weight fraction, h the centre of gravity height and L the wheelbase. On a road tyre with a friction coefficient of 1.15, the layout differences are large.
| Layout | Static rear | CG height | Wheelbase | Limit | 0 to 100 km/h |
|---|---|---|---|---|---|
| Rear engine | 61 % | 0.45 m | 2.45 m | 8.72 m/s² | 3.18 s |
| Mid engine | 57 % | 0.42 m | 2.65 m | 7.86 m/s² | 3.53 s |
| Front engine, 50:50 | 50 % | 0.48 m | 2.80 m | 7.03 m/s² | 3.95 s |
| Front engine GT | 48 % | 0.50 m | 2.85 m | 6.78 m/s² | 4.10 s |
The span from top to bottom is 0.91 s to 100 km/h on identical tyres with identical power. Nothing in that table is about the engine.
Why the same figure hurts under braking
Braking transfers load forward, so a rear biased car unloads its rear axle exactly when it is being asked to help stop the car. Rear brakes on such a car are working with less vertical load than the static figure suggests, and the electronic brake distribution has to take that into account or the rear axle locks first, which is the least stable failure mode a car has.
It also affects stability under trailing brake into a corner, where an unloaded rear axle carrying lateral load has very little margin. That is the classic rear engined car characteristic, and the modern answer to it is electronics rather than a different engine position: stability control, torque vectoring and rear axle steering all exist partly to manage a distribution chosen for other reasons.
Polar moment, which distribution does not capture
Two cars can share the same 50:50 static distribution and behave completely differently, because the figure says where the mass balances and not how far it is spread. A mid engined car concentrates its heaviest components near the centre, giving a low polar moment of inertia, which makes it quick to change direction and quick to lose the rear once it starts to rotate. A front engined car with a rear mounted gearbox achieves the same balance with masses at both ends, giving a high polar moment: slower to turn in and more forgiving once it is sliding.
Neither is better. They are different characters, and the static distribution figure cannot distinguish them, which is a reason to treat it as one number among several rather than as a summary of the chassis.
Questions readers ask
How does weight distribution affect handling?
It sets how much vertical load each axle carries before any transfer happens, and different manoeuvres want different answers. Accelerating and exiting corners want weight at the rear, braking and turn-in want it at the front. 50:50 is the distribution that is never badly wrong.
Is 50:50 the optimum?
Not for any single manoeuvre. It is a compromise that avoids being badly wrong anywhere, which is a real virtue. A rear engined layout at 61 per cent rear launches nearly a second quicker to 100 km/h than a front engined car at 48 per cent on the same tyres.
Why do rear engined cars launch so well?
Because more of the mass already sits over the driven axle before load transfer adds more. At 61 per cent rear with a short wheelbase, the launch limit is 8.72 m/s² against 6.78 for a front engined car at 48 per cent, a gap of 0.91 s to 100 km/h.
What does a rear biased distribution cost?
Braking and turn-in. Load transfers forward under braking, so a rear biased car unloads the axle it needs, and brake distribution has to compensate or the rear locks first. It also has less margin under trailing brake into a corner.
What is polar moment of inertia?
A measure of how far the mass is spread from the centre rather than where it balances. Two cars can both be 50:50 and behave differently: a mid engined car with masses concentrated centrally changes direction quickly, a front engined car with a rear gearbox is slower to turn and more forgiving when sliding.
Sources
- Autosport technical forum, tyre coefficient of friction, on the friction values used in the launch limit calculations.
- Vehicle Physics Pro, tyre model documentation, on load transfer, load sensitivity and axle behaviour.
- Commission Regulation (EU) No 1230/2012, on mass in running order, the weight against which distribution is properly quoted.
Launch limits use a = μgf / (1 − μh/L) with a friction coefficient of 1.15 and no aerodynamic downforce. Layout values are representative rather than specific to any model.