Top Speed
Cd vs CdA: The Drag Number Brochures Get Wrong
A drag coefficient without a frontal area cannot be compared between cars. A saloon at Cd 0.28 can push more air than a sports car at Cd 0.33, because area is the other half of the term.
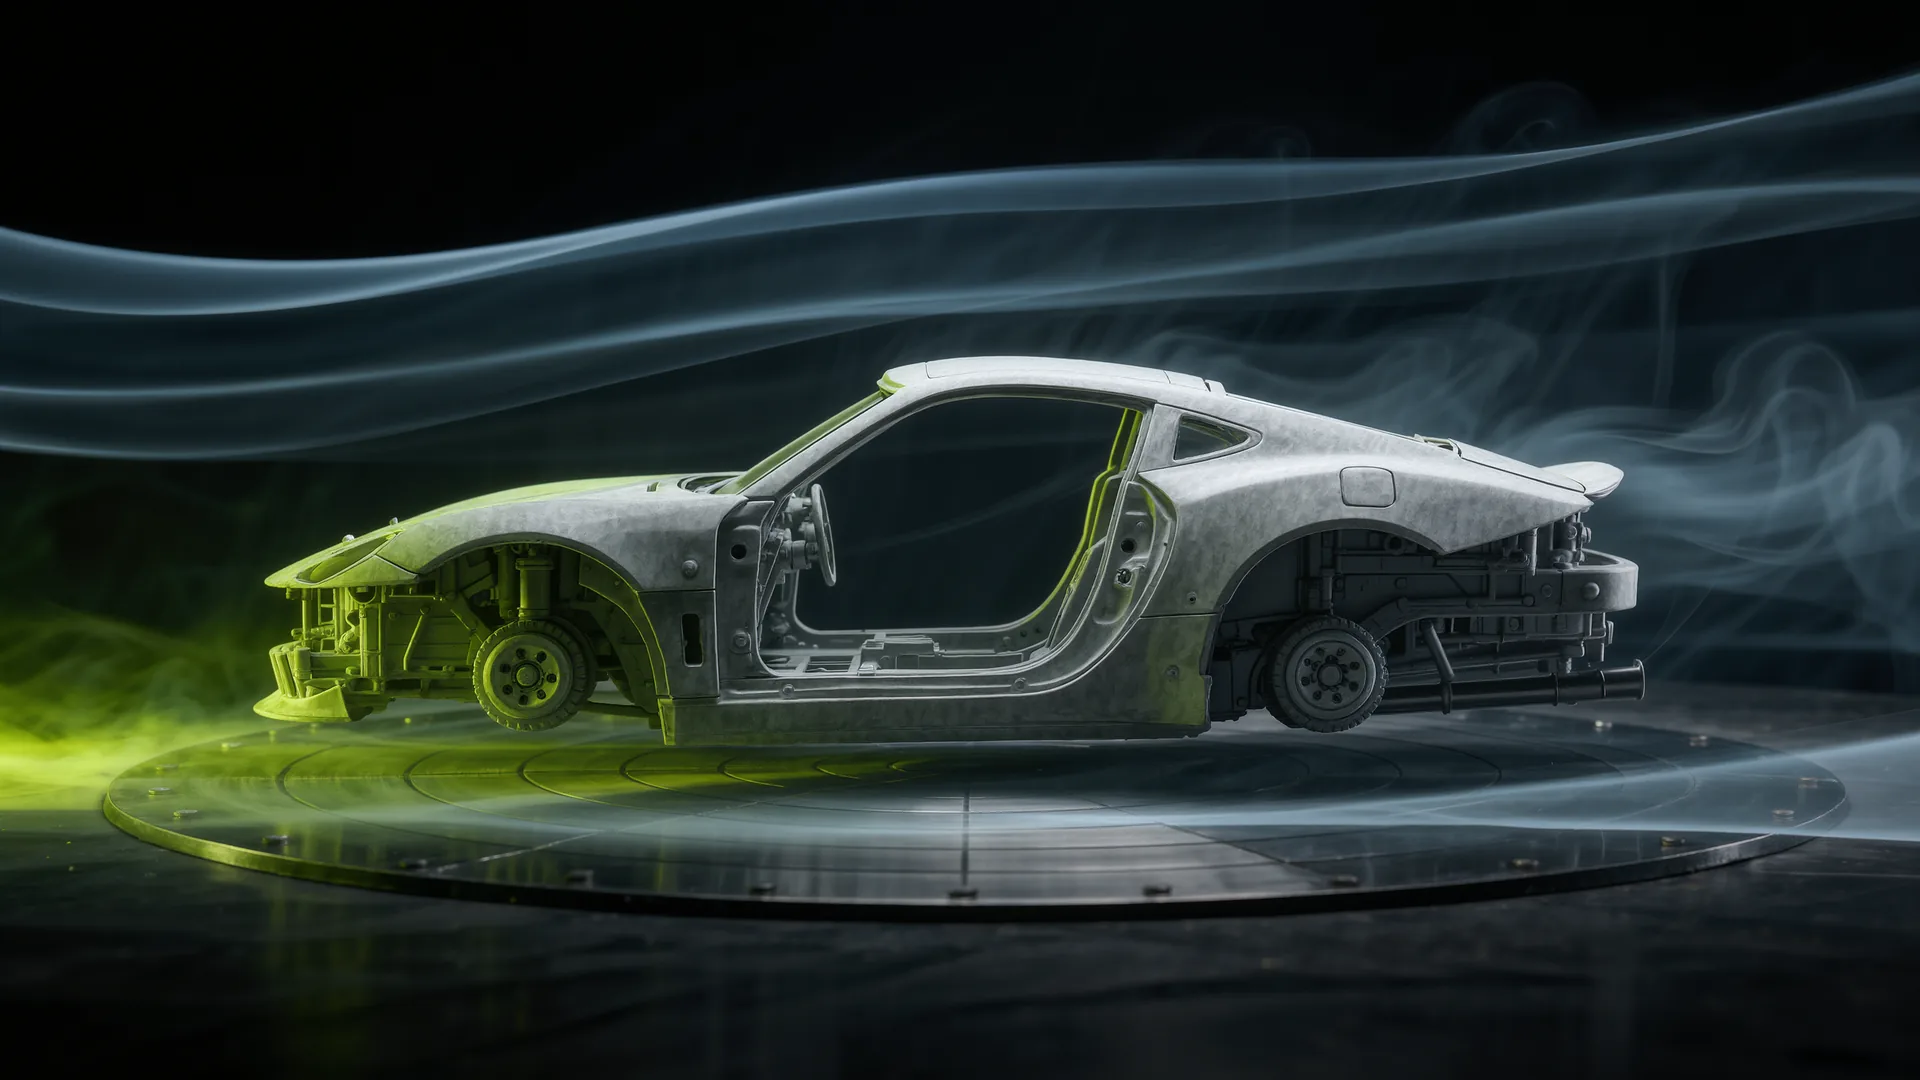
The drag coefficient is a shape efficiency figure, not a drag figure. What appears in the physics is CdA, the coefficient multiplied by frontal area, and only that product can be compared between cars. A large saloon at Cd 0.28 with 2.30 m² of frontal area has a CdA of 0.644 m². A compact sports car at a worse looking Cd 0.33 with 1.90 m² has 0.627 m², and it is the slipperier car in absolute terms.
What each term actually is
Drag force is F = ½ · ρ · CdA · v². Frontal area A is the projected silhouette of the vehicle seen head on, in square metres. The drag coefficient Cd is defined so that it removes area from the comparison, which makes it a measure of how well a shape manages air per unit of frontal area. That is genuinely useful to an aerodynamicist comparing two roof shapes on the same body. It is close to useless for comparing a hatchback with an estate.
The reason Cd alone dominates brochures is that it is a single dimensionless number that sounds like a score, and lower is better. Frontal area is rarely published, which makes the product impossible to reconstruct without measuring the car.
| Body type | Typical frontal area | Typical Cd | Resulting CdA | Drag at 200 km/h |
|---|---|---|---|---|
| Compact sports car | 1.85 m² | 0.33 | 0.611 m² | 1,155 N |
| Mid engine supercar | 1.95 m² | 0.36 | 0.702 m² | 1,328 N |
| Executive saloon | 2.25 m² | 0.26 | 0.585 m² | 1,106 N |
| Large estate | 2.40 m² | 0.29 | 0.696 m² | 1,316 N |
| Performance SUV | 2.80 m² | 0.34 | 0.952 m² | 1,800 N |
The executive saloon has the lowest CdA of the five despite being far from the smallest car, and the mid engine supercar is worse than the estate. Neither of those results is visible from the drag coefficient alone, and both are the kind of thing a specification comparison gets wrong every day.
Why supercars have unimpressive drag coefficients
A high performance car frequently posts a worse Cd than an ordinary saloon, and it is not incompetence. Three requirements fight low drag directly.
- Cooling. Air entering the body for radiators, intercoolers, brakes and gearbox oil has to be slowed, turned and expelled, and every one of those steps costs momentum. A car making three times the power has to reject roughly three times the heat.
- Downforce. Generating vertical load requires turning air, and turning air produces drag. This is a physical coupling, not a design failure, and it is why cars with adjustable aerodynamics have a low drag setting for straights.
- Tyres. Wide tyres widen the car and expose more rotating, turbulent structure to the airflow. Wheels and wheel arches are a large share of a modern car's total drag.
How much CdA is worth at the top end
Because power scales linearly with CdA and with the cube of speed, top speed scales with the cube root of the inverse of CdA. That makes area reduction a strong lever high up and a weak one low down.
- A 5 per cent reduction in CdA is worth about 1.7 per cent more top speed. On a 330 km/h car, 5.6 km/h.
- A 10 per cent reduction is worth about 3.4 per cent. On the same car, 11.4 km/h, for no additional power.
- Going the other way, adding a roof box that raises CdA by 20 per cent costs about 6.3 per cent of top speed and considerably more fuel at motorway cruise, where drag already dominates.
At ordinary speeds the same figure matters for a different reason. At 120 km/h a passenger car spends roughly half its energy on aerodynamic drag and half on rolling resistance and losses, so CdA is a first order term in consumption long before it is a top speed term.
How to compare two cars honestly
Ask for both numbers, and if frontal area is not published, approximate it. A workable estimate is 0.81 to 0.85 multiplied by track width multiplied by height, which is accurate enough to rank two cars that differ by more than a few per cent. Then compare CdA, and treat any published Cd quoted without an area as a marketing figure rather than an engineering one.
Questions readers ask
What is the difference between Cd and CdA?
Cd is a dimensionless measure of how efficiently a shape manages air per unit of frontal area. CdA is that coefficient multiplied by the actual frontal area, and it is the term that appears in the drag equation. Only CdA can be compared between vehicles of different size.
Can a car with a worse Cd have less drag?
Yes, whenever it is smaller. A sports car at Cd 0.33 with 1.90 m² frontal area has a CdA of 0.627 m², slightly lower than a saloon at Cd 0.28 with 2.30 m², which comes to 0.644 m². The apparently worse car pushes less air.
Why do supercars have high drag coefficients?
Cooling airflow, downforce and wide tyres all cost drag. A car making three times the power rejects roughly three times the heat, downforce is produced by turning air which inherently creates drag, and wide tyres widen the body and add turbulent structure.
How do I estimate frontal area if it is not published?
Multiply track width by height and apply a factor of about 0.81 to 0.85 to account for the shape not filling the rectangle. It is an approximation, but it is accurate enough to rank cars whose CdA differs by more than a few per cent.
How much top speed does drag reduction buy?
Top speed scales with the cube root of the inverse of CdA, so a 10 per cent reduction gives about 3.4 per cent more speed. On a 330 km/h car that is 11.4 km/h without touching the engine.
Sources
- Bugatti Newsroom, breaking the 300 mph barrier, on the bodywork changes made to reduce drag for a maximum speed run.
- UNECE Regulation No. 85, on the reference air conditions used when converting drag into a power requirement.
- Regulation (EU) 2020/740, on rolling resistance, the other half of a car's resistance at moderate speed.
Drag forces are calculated at 200 km/h with ρ = 1.225 kg/m³. Frontal areas and drag coefficients in the table are representative values for each body type rather than figures for a specific model.